2019 UK local government election
2019 Havant Borough Council election
|
|
11 of 38 seats to Havant Borough Council
20 seats needed for a majority |
|---|
| | First party | Second party | | | | | | Party | Conservative | Labour | | Seats before | 33 | 2 | | Seats won | 11 | 0 | | Seats after | 33 | 2 |
| | | Third party | Fourth party | | | | | | Party | UKIP | Liberal Democrats | | Seats before | 2 | 1 | | Seats won | 0 | 0 | | Seats after | 2 | 1 | |
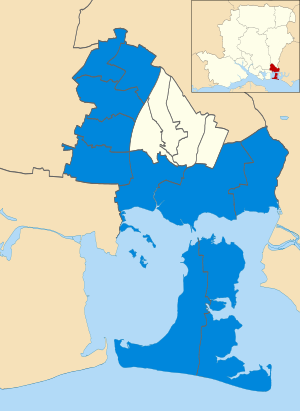 Results by ward |
Council control before election
Conservative
| Council control after election
Conservative
| |
The 2019 Havant Borough Council election took place on 2 May 2019 to elect members of Havant Borough Council in England. This was on the same day as other local elections.
After the election, the composition of the council was:
- Conservatives: 33
- Labour: 2
- UKIP: 2
- Liberal Democrats: 1[1][2][3]
Results
The Conservatives successfully defended all 11 seats up for election this year, with the Council composition remaining the same. However, the vote share for both the Conservatives and Labour fell, whilst the UKIP, Liberal Democrats, and Green vote share rose.
The table below only tallies the votes of the highest polling candidate for each party within each ward. This is known as the top candidate method and is often used for multi-member plurality elections.
Havant local election result 2019 | Party | Seats | Gains | Losses | Net gain/loss | Seats % | Votes % | Votes | +/− |
| | Conservative | 11 | 0 | 0 |  | 100 | 43.22 | 10,311 |  18.02 18.02 |
| | UKIP | 0 | 0 | 0 | | 0 | 20.69 | 4,937 |  18.5 18.5 |
| | Liberal Democrats | 0 | 0 | 0 | | 0 | 18.91 | 4,512 | 3.87 |
| | Labour | 0 | 0 | 0 | | 0 | 10.81 | 2,579 | 7.61 |
| | Green | 0 | 0 | 0 | | 0 | 6.35 | 1,515 | 3.28 |
Ward results
Bedhampton
Bedhampton | Party | Candidate | Votes | % | ±% |
| | Conservative | Mark Inkster | 832 | 38.13 | |
| | Liberal Democrats | Philippa Gray | 731 | 33.50 | |
| | UKIP | Graham Stouse | 410 | 18.79 | |
| | Labour | Freya Savidge-Conway | 209 | 9.57 | |
| Majority | 101 | | |
| Turnout | 2,182 | 29.39 | |
| | Conservative hold | Swing | | |
Cowplain
Cowplain | Party | Candidate | Votes | % | ±% |
| | Conservative | Narinder Bains | 956 | 47.60 | |
| | UKIP | Jason Gillen | 438 | 21.81 | |
| | Liberal Democrats | Lisa Jackson | 324 | 16.13 | |
| | Green | Bruce Holman | 289 | 14.39 | |
| Majority | 23.73 | | |
| Turnout | 2,008 | 27.41 | |
| | Conservative hold | Swing | | |
Emsworth
Emsworth | Party | Candidate | Votes | % | ±% |
| | Conservative | Julie Thain-Smith | 1,335 | 41.33 | |
| | Liberal Democrats | Jane Briggs | 781 | 24.17 | |
| | Green | Georgina-Kate Adams | 498 | 15.41 | |
| | Labour | Paula Elsey | 322 | 9.96 | |
| | UKIP | Patricia Farnham | 294 | 9.10 | |
| Majority | 554 | | |
| Turnout | 3,230 | 40.08 | |
| | Conservative hold | Swing | | |
Hart Plain
Hart Plain | Party | Candidate | Votes | % | ±% |
| | Conservative | David Jenner | 909 | 42.99 | |
| | UKIP | Roger Johnson | 589 | 27.86 | |
| | Labour | Howard Sherlock | 226 | 10.69 | |
| | Liberal Democrats | Suzette Gray | 196 | 9.27 | |
| | Green | John Colman | 194 | 9.17 | |
| Majority | 320 | 15.13 | |
| Turnout | 2,114 | 27.86 | |
| | Conservative hold | Swing | | |
Hayling East
Hayling East | Party | Candidate | Votes | % | ±% |
| | Conservative | Michael Wilson | 1,137 | 43.44 | |
| | UKIP | Christopher Littlewood | 635 | 24.26 | |
| | Liberal Democrats | Wilf Forrow | 419 | 16.01 | |
| | Green | Natasha Green | 244 | 9.32 | |
| | Labour | Jez Cole | 182 | 6.95 | |
| Majority | 592 | 22.62 | |
| Turnout | 2,617 | 35.00 | |
| | Conservative hold | Swing | | |
Hayling West
Hayling West | Party | Candidate | Votes | % | ±% |
| | Conservative | Clare Satchwell | 1,273 | 44.79 | |
| | UKIP | John Perry | 733 | 25.79 | |
| | Liberal Democrats | Paul Gray | 570 | 20.05 | |
| | Labour | Sheree Earnshaw | 266 | 9.35 | |
| Majority | 540 | 40.9 | |
| Turnout | 2,842 | 40.9 | |
| | Conservative hold | Swing | | |
Purbrook
Purbrook (2) | Party | Candidate | Votes | % | ±% |
| | Conservative | Gary Hughes | 1,003 | 46.74 | |
| | Conservative | Husky Patel | 762 | 35.51 | |
| | UKIP | Peter Brierley | 466 | 21.71 | |
| | UKIP | Allan Darby | 373 | 17.38 | |
| | Liberal Democrats | Antonia Harrison | 319 | 14.86 | |
| | Green | Rosie Blackburn | 290 | 13.51 | |
| | Liberal Democrats | Paul Tansom | 277 | 12.91 | |
| | Labour | Munazza Faiz | 268 | 12.49 | |
| | Labour | Simon Hagan | 243 | 11.32 | |
| Turnout | 2,146 | 28.56 | |
| | Conservative hold | Swing | | |
| | Conservative hold | Swing | | |
St Faiths
St. Faiths | Party | Candidate | Votes | % | ±% |
| | Conservative | Tim Pike | 1,172 | 44.01 | |
| | Liberal Democrats | Catherine Billam | 545 | 20.46 | |
| | UKIP | Sharon Collings | 496 | 18.62 | |
| | Labour | Simon Cattermole | 450 | 16.89 | |
| Majority | 627 | 23.54 | |
| Turnout | 2,663 | 34.36 | |
| | Conservative hold | Swing | | |
Stakes
Stakes | Party | Candidate | Votes | % | ±% |
| | Conservative | Diana Patrick | 720 | 42.98 | |
| | Labour | Rosamund Knight | 388 | 23.16 | |
| | UKIP | Matthew Travis | 371 | 22.14 | |
| | Liberal Democrats | Alun Williams | 196 | 11.70 | |
| Majority | 332 | 19.82 | |
| Turnout | 1,675 | 21.93 | |
| | Conservative hold | Swing | | |
Waterloo
Waterloo | Party | Candidate | Votes | % | ±% |
| | Conservative | Gwen Robinson | 1,215 | 50.22 | |
| | UKIP | Soraya Wilson | 505 | 20.87 | |
| | Liberal Democrats | John Pratley | 431 | 17.81 | |
| | Labour | Tony Berry | 268 | 11.07 | |
| Majority | 710 | 29.35 | |
| Turnout | 2,419 | 29.87 | |
| | Conservative hold | Swing | | |
References
- ^ "Local elections 2019: Here's how you voted in the Havant Borough Council area". www.portsmouth.co.uk. Retrieved 26 September 2020.
- ^ "Local elections 2019: Little change at Havant Borough Council as Conservatives score a clean sweep". www.portsmouth.co.uk. Retrieved 26 September 2020.
- ^ "Local elections 2019: Tories sweep Havant Borough Council to hold all 11 seats". www.portsmouth.co.uk. Retrieved 26 September 2020.


 18.02
18.02  18.5
18.5  Council elections in Hampshire


