Courniou
Commune in Occitania, France

Coat of arms
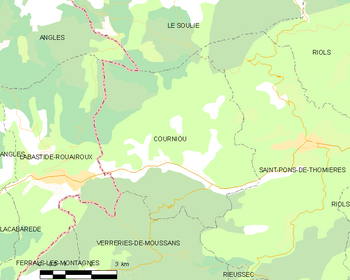
Location of Courniou

(2020–2026) Catherine Sonzogni[1]
1
(2021)[2]
34086 /34220
(avg. 362 m or 1,188 ft)
Courniou (French pronunciation: [kuʁnju]; Occitan: Cornhon) is a commune in the Hérault department in southern France.
Geography
Climate
Courniou has a warm-summer mediterranean climate (Köppen climate classification Csb). The average annual temperature in Courniou is 11.9 °C (53.4 °F). The average annual rainfall is 1,444.7 mm (56.88 in) with December as the wettest month. The temperatures are highest on average in July, at around 20.2 °C (68.4 °F), and lowest in January, at around 4.8 °C (40.6 °F). The highest temperature ever recorded in Courniou was 39.3 °C (102.7 °F) on 12 August 2003; the coldest temperature ever recorded was −15.5 °C (4.1 °F) on 16 January 1985.
| Climate data for Courniou (1981–2010 averages, extremes 1971−2014) | |||||||||||||
|---|---|---|---|---|---|---|---|---|---|---|---|---|---|
| Month | Jan | Feb | Mar | Apr | May | Jun | Jul | Aug | Sep | Oct | Nov | Dec | Year |
| Record high °C (°F) | 19.9 (67.8) | 23.0 (73.4) | 26.5 (79.7) | 28.2 (82.8) | 31.8 (89.2) | 36.0 (96.8) | 35.9 (96.6) | 39.3 (102.7) | 33.0 (91.4) | 29.1 (84.4) | 24.5 (76.1) | 22.0 (71.6) | 39.3 (102.7) |
| Mean daily maximum °C (°F) | 8.0 (46.4) | 8.8 (47.8) | 11.9 (53.4) | 14.3 (57.7) | 18.5 (65.3) | 22.6 (72.7) | 25.8 (78.4) | 25.6 (78.1) | 21.7 (71.1) | 16.8 (62.2) | 11.4 (52.5) | 8.6 (47.5) | 16.2 (61.2) |
| Daily mean °C (°F) | 4.8 (40.6) | 5.3 (41.5) | 7.8 (46.0) | 9.9 (49.8) | 13.7 (56.7) | 17.4 (63.3) | 20.2 (68.4) | 20.0 (68.0) | 16.6 (61.9) | 12.9 (55.2) | 8.1 (46.6) | 5.5 (41.9) | 11.9 (53.4) |
| Mean daily minimum °C (°F) | 1.7 (35.1) | 1.8 (35.2) | 3.7 (38.7) | 5.6 (42.1) | 8.9 (48.0) | 12.1 (53.8) | 14.5 (58.1) | 14.4 (57.9) | 11.5 (52.7) | 9.1 (48.4) | 4.9 (40.8) | 2.3 (36.1) | 7.6 (45.7) |
| Record low °C (°F) | −15.5 (4.1) | −11.7 (10.9) | −12.5 (9.5) | −2.5 (27.5) | −1.2 (29.8) | 3.5 (38.3) | 5.5 (41.9) | 5.0 (41.0) | −0.3 (31.5) | −2.0 (28.4) | −8.2 (17.2) | −10.5 (13.1) | −15.5 (4.1) |
| Average precipitation mm (inches) | 161.0 (6.34) | 148.5 (5.85) | 117.9 (4.64) | 151.6 (5.97) | 102.6 (4.04) | 58.0 (2.28) | 35.4 (1.39) | 60.5 (2.38) | 92.6 (3.65) | 162.8 (6.41) | 174.5 (6.87) | 179.3 (7.06) | 1,444.7 (56.88) |
| Average precipitation days (≥ 1.0 mm) | 13.6 | 12.4 | 12.0 | 12.4 | 10.0 | 7.0 | 5.1 | 6.5 | 7.8 | 11.9 | 12.7 | 12.7 | 124.0 |
| Source: Meteociel[3] | |||||||||||||
Population
| Year | Pop. | ±% |
|---|---|---|
| 1962 | 385 | — |
| 1968 | 529 | +37.4% |
| 1975 | 503 | −4.9% |
| 1982 | 537 | +6.8% |
| 1990 | 595 | +10.8% |
| 1999 | 606 | +1.8% |
| 2008 | 620 | +2.3% |
See also
References
- ^ "Répertoire national des élus: les maires". data.gouv.fr, Plateforme ouverte des données publiques françaises (in French). 9 August 2021.
- ^ "Populations légales 2021". The National Institute of Statistics and Economic Studies. 28 December 2023.
- ^ "Normales et records pour Courniou (34)". Meteociel. Retrieved 5 June 2022.
Wikimedia Commons has media related to Courniou.
- v
- t
- e

- Abeilhan
- Adissan
- Agde
- Agel
- Agonès
- Aigne
- Aigues-Vives
- Les Aires
- Alignan-du-Vent
- Aniane
- Arboras
- Argelliers
- Aspiran
- Assas
- Assignan
- Aumelas
- Aumes
- Autignac
- Avène
- Azillanet
- Babeau-Bouldoux
- Baillargues
- Balaruc-les-Bains
- Balaruc-le-Vieux
- Bassan
- Beaufort
- Beaulieu
- Bédarieux
- Bélarga
- Berlou
- Bessan
- Bézierssubpr
- Boisseron
- Boisset
- La Boissière
- Le Bosc
- Boujan-sur-Libron
- Le Bousquet-d'Orb
- Bouzigues
- Brenas
- Brignac
- Brissac
- Buzignargues
- Cabrerolles
- Cabrières
- Cambon-et-Salvergues
- Campagnan
- Campagne
- Camplong
- Candillargues
- Canet
- Capestang
- Carlencas-et-Levas
- Cassagnoles
- Castanet-le-Haut
- Castelnau-de-Guers
- Castelnau-le-Lez
- Castries
- La Caunette
- Causse-de-la-Selle
- Causses-et-Veyran
- Caussiniojouls
- Caux
- Le Caylar
- Cazedarnes
- Cazevieille
- Cazilhac
- Cazouls-d'Hérault
- Cazouls-lès-Béziers
- Cébazan
- Ceilhes-et-Rocozels
- Celles
- Cers
- Cessenon-sur-Orb
- Cesseras
- Ceyras
- Clapiers
- Claret
- Clermont-l'Hérault
- Colombières-sur-Orb
- Colombiers
- Combaillaux
- Combes
- Corneilhan
- Coulobres
- Courniou
- Cournonsec
- Cournonterral
- Creissan
- Le Crès
- Le Cros
- Cruzy
- Dio-et-Valquières
- Entre-Vignes
- Espondeilhan
- Fabrègues
- Faugères
- Félines-Minervois
- Ferrals-les-Montagnes
- Ferrières-les-Verreries
- Ferrières-Poussarou
- Florensac
- Fontanès
- Fontès
- Fos
- Fouzilhon
- Fozières
- Fraisse-sur-Agout
- Frontignan
- Gabian
- Galargues
- Ganges
- Garrigues
- Gigean
- Gignac
- Gorniès
- Grabels
- Graissessac
- La Grande-Motte
- Guzargues
- Hérépian
- Jacou
- Joncels
- Jonquières
- Juvignac
- Lacoste
- Lagamas
- Lamalou-les-Bains
- Lansargues
- Laroque
- Lattes
- Laurens
- Lauret
- Lauroux
- Lavalette
- Lavérune
- Lespignan
- Lézignan-la-Cèbe
- Liausson
- Lieuran-Cabrières
- Lieuran-lès-Béziers
- Lignan-sur-Orb
- La Livinière
- Lodèvesubpr
- Loupian
- Lunas
- Lunel
- Lunel-Viel
- Magalas
- Maraussan
- Margon
- Marseillan
- Marsillargues
- Mas-de-Londres
- Les Matelles
- Mauguio
- Maureilhan
- Mérifons
- Mèze
- Minerve
- Mireval
- Mons
- Montady
- Montagnac
- Montarnaud
- Montaud
- Montbazin
- Montblanc
- Montels
- Montesquieu
- Montferrier-sur-Lez
- Montouliers
- Montoulieu
- Montpellierpref
- Montpeyroux
- Moulès-et-Baucels
- Mourèze
- Mudaison
- Murles
- Murviel-lès-Béziers
- Murviel-lès-Montpellier
- Nébian
- Neffiès
- Nézignan-l'Évêque
- Nissan-lez-Enserune
- Nizas
- Notre-Dame-de-Londres
- Octon
- Olargues
- Olmet-et-Villecun
- Olonzac
- Oupia
- Pailhès
- Palavas-les-Flots
- Pardailhan
- Paulhan
- Pégairolles-de-Buèges
- Pégairolles-de-l'Escalette
- Péret
- Pérols
- Pézenas
- Pézènes-les-Mines
- Pierrerue
- Pignan
- Pinet
- Plaissan
- Les Plans
- Poilhes
- Pomérols
- Popian
- Portiragnes
- Le Pouget
- Poujols
- Le Poujol-sur-Orb
- Poussan
- Pouzolles
- Pouzols
- Le Pradal
- Prades-le-Lez
- Prades-sur-Vernazobre
- Prémian
- Le Puech
- Puéchabon
- Puilacher
- Puimisson
- Puissalicon
- Puisserguier
- Quarante
- Restinclières
- Rieussec
- Riols
- Les Rives
- Romiguières
- Roquebrun
- Roqueredonde
- Roquessels
- Rosis
- Rouet
- Roujan
- Saint-André-de-Buèges
- Saint-André-de-Sangonis
- Saint-Aunès
- Saint-Bauzille-de-la-Sylve
- Saint-Bauzille-de-Montmel
- Saint-Bauzille-de-Putois
- Saint-Brès
- Saint-Chinian
- Saint-Clément-de-Rivière
- Saint-Drézéry
- Sainte-Croix-de-Quintillargues
- Saint-Étienne-d'Albagnan
- Saint-Étienne-de-Gourgas
- Saint-Étienne-Estréchoux
- Saint-Félix-de-l'Héras
- Saint-Félix-de-Lodez
- Saint-Gély-du-Fesc
- Saint-Geniès-de-Fontedit
- Saint-Geniès-des-Mourgues
- Saint-Geniès-de-Varensal
- Saint-Georges-d'Orques
- Saint-Gervais-sur-Mare
- Saint-Guilhem-le-Désert
- Saint-Guiraud
- Saint-Hilaire-de-Beauvoir
- Saint-Jean-de-Buèges
- Saint-Jean-de-Cornies
- Saint-Jean-de-Cuculles
- Saint-Jean-de-Fos
- Saint-Jean-de-la-Blaquière
- Saint-Jean-de-Minervois
- Saint-Jean-de-Védas
- Saint-Julien
- Saint-Just
- Saint-Martin-de-l'Arçon
- Saint-Martin-de-Londres
- Saint-Mathieu-de-Tréviers
- Saint-Maurice-Navacelles
- Saint-Michel
- Saint-Nazaire-de-Ladarez
- Saint-Nazaire-de-Pézan
- Saint-Pargoire
- Saint-Paul-et-Valmalle
- Saint-Pierre-de-la-Fage
- Saint-Pons-de-Mauchiens
- Saint-Pons-de-Thomières
- Saint-Privat
- Saint-Saturnin-de-Lucian
- Saint-Sériès
- Saint-Thibéry
- Saint-Vincent-de-Barbeyrargues
- Saint-Vincent-d'Olargues
- Salasc
- La Salvetat-sur-Agout
- Saturargues
- Saussan
- Saussines
- Sauteyrargues
- Sauvian
- Sérignan
- Servian
- Sète
- Siran
- Sorbs
- Soubès
- Le Soulié
- Soumont
- Sussargues
- Taussac-la-Billière
- Teyran
- Thézan-lès-Béziers
- Tourbes
- La Tour-sur-Orb
- Tressan
- Le Triadou
- Usclas-d'Hérault
- Usclas-du-Bosc
- La Vacquerie-et-Saint-Martin-de-Castries
- Vacquières
- Vailhan
- Vailhauquès
- Valergues
- Valflaunès
- Valmascle
- Valras-Plage
- Valros
- Vélieux
- Vendargues
- Vendémian
- Vendres
- Verreries-de-Moussans
- Vias
- Vic-la-Gardiole
- Vieussan
- Villemagne-l'Argentière
- Villeneuve-lès-Béziers
- Villeneuve-lès-Maguelone
- Villeneuvette
- Villespassans
- Villetelle
- Villeveyrac
- Viols-en-Laval
- Viols-le-Fort
- pref: prefecture
- subpr: subprefecture
Authority control databases | |
|---|---|
| International |
|
| National |
|
 | This Hérault geographical article is a stub. You can help Wikipedia by expanding it. |
- v
- t
- e


